Are you using Docker to manage your infrastructure? You can use CopperEgg’ to monitor your Docker Host & Containers for availability and performance. As an illustration, you can configure and receive alerts for the following scenarios:
- Availability: alert for availability of different resources on Docker Host and Containers.
- If the Host CopperEgg value falls to 0, it implies that the Host is no longer available for monitoring.
- Memory/Swap Availability can also be monitored and alerts can be configured for the same.
- Performance: alert if the.
- Bytes_read and bytes_written values track the read-write performance of the Docker Host/Container’s
- IO Read/Write Time values track the time spent in reading/writing the i/o operations..
The full set of Docker host & containers metrics that are monitored is available here
Prerequisites
CopperEgg offers a SAAS based out-of-the-box monitoring solution for Docker Host and Containers that is easy to set up. If you have docker installed in your server that is monitored on our premises then you will get a notification on the server widget to enable docker monitoring and simply following the instructions you can start to monitor your docker host and containers on that particular server.
- CopperEgg account. If you don’t already have an account, you can sign up for a 14 day FREE TRIAL of CopperEgg here (no Credit Card required).
- Docker up and running in your system.
- Root access to server to install the CopperEgg Monitoring Agent.
Monitor Docker using out-of-the-box Monitoring Agent installer from CopperEgg
There are four steps that you need to do to start monitoring your Docker Host/Containers:
- CopperEgg Monitoring Agent Installation
- Verify that your Server on Server Dashboard is up and running.
- Enable Docker Monitoring for your docker server.
- Configure alerts to be notified about Docker Host or Containers issues
1.Copper Monitoring Agent Installation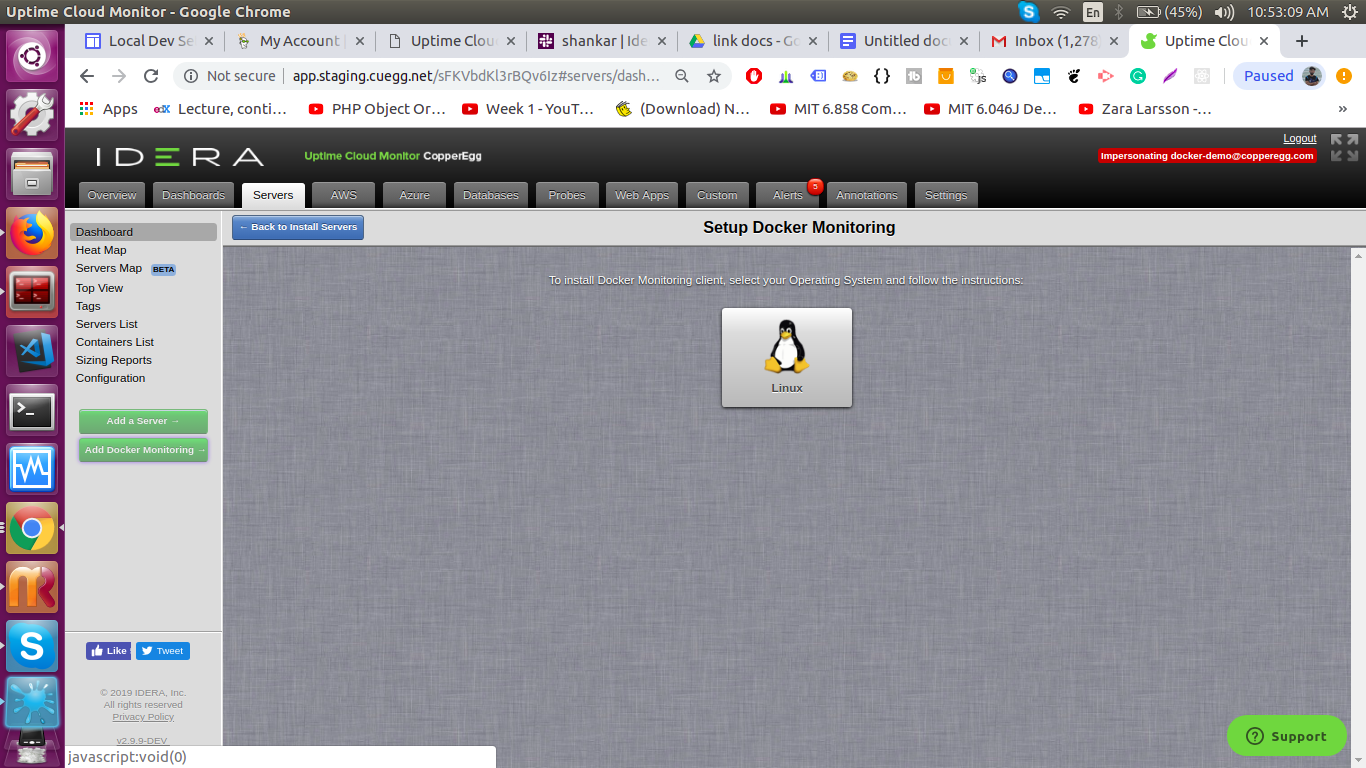
Figure 1: In your CopperEgg Account, navigate to Servers > Add Docker Monitoring
Login to your CopperEgg account and navigate to Servers tab -> Add Docker Monitoring. Select Operating System and install the monitoring agent as instructed.
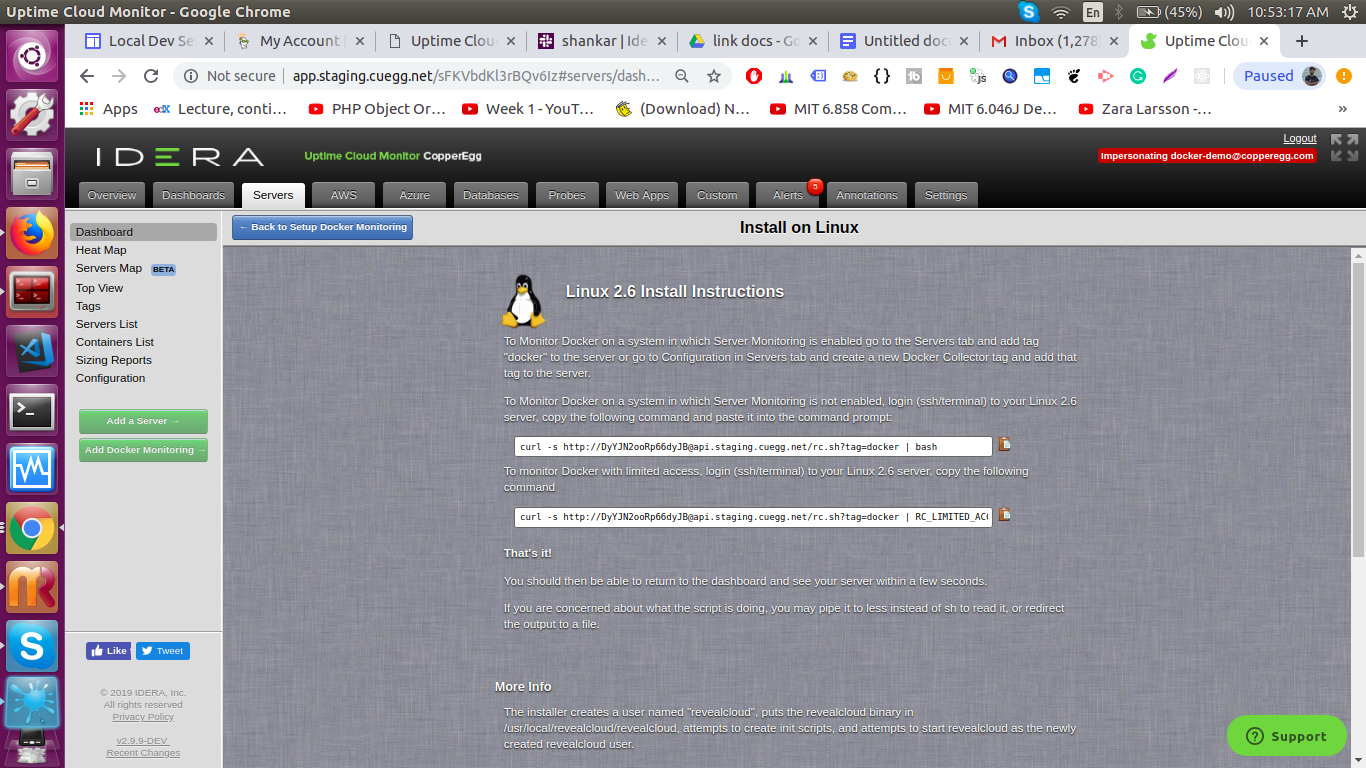
Figure 2: The Monitoring agent installation script
Click on  icon to copy the installer script to your clipboard. Paste the command into the terminal window on the server where you want to install the agent. Script can be run on the server running Docker, or it can be a different server, but this server will need to be continually running in order to monitor Docker Host and Containers.
As soon as the script is run on a terminal with root access, it starts downloading the required monitoring agent on your server. As you run the script for enabling docker monitoring it will add the default `docker` tag to the server instance that will show up in the server’s dashboard tab. 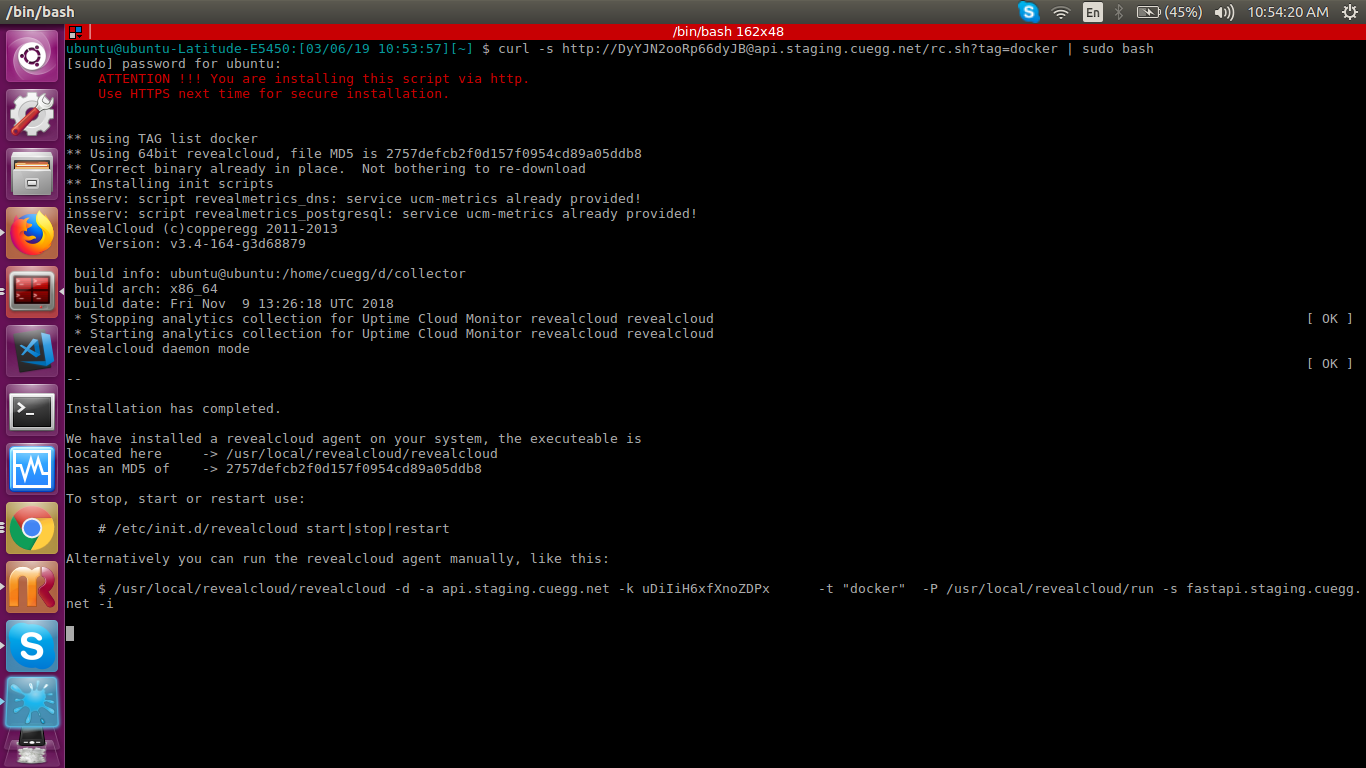
Figure 3: Executing the Docker Monitoring agent installation script.
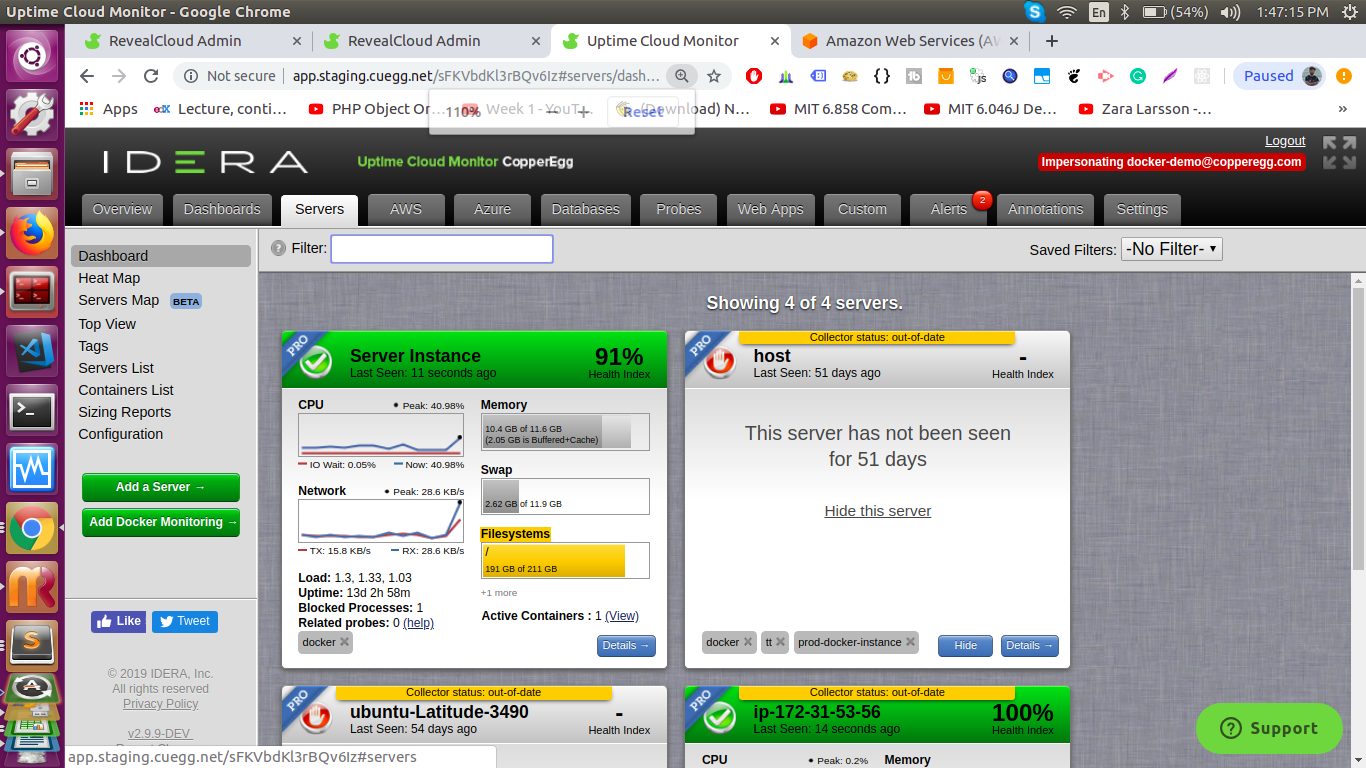
Figure 4: Server Instance widget that will show up in server dashboard. With a docker tag automatically applied to this instance.
2.Verify that your Docker Monitoring up and running
Navigate to Servers Tab -> Dashboard you will see the server instance widget click on details for your server widget and you will see three tabs navigation in details panel as shown below.
Figure 5: Server Instance widget that will show up in server dashboard. With a details button to open detailed graph view for this instance.
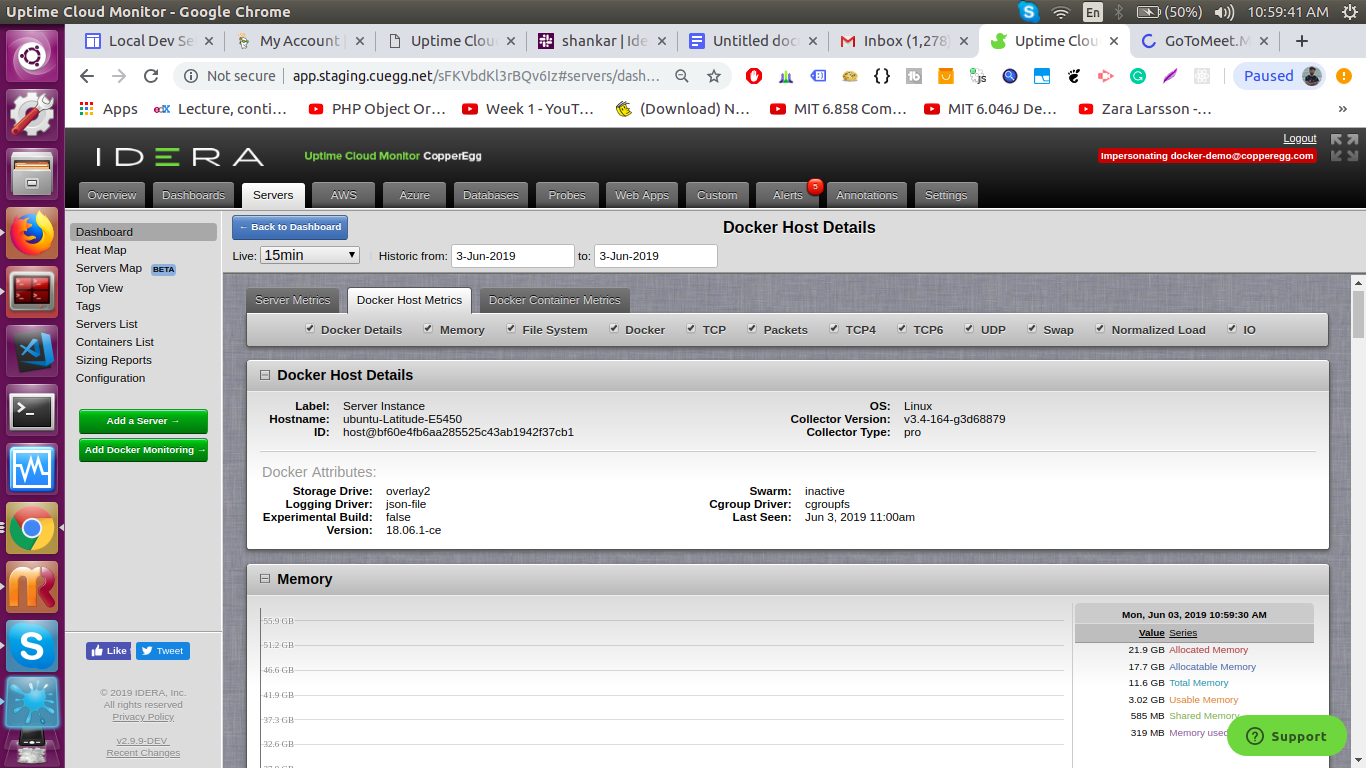
Figure 6: Server Details Panel navigation tabs
From the above navigation tabs you can view `Docker Host Metrics` tab and `Docker Container Metrics` tab they should show the charted view for your docker host and containers as shown.
Docker Hosts Metrics Tab

Figure 7: A Docker Host Metrics tab with charted metrics view.
As the installed script executes, you will notice data samples appearing on the widgets for this Dashboard as well as in the details page.
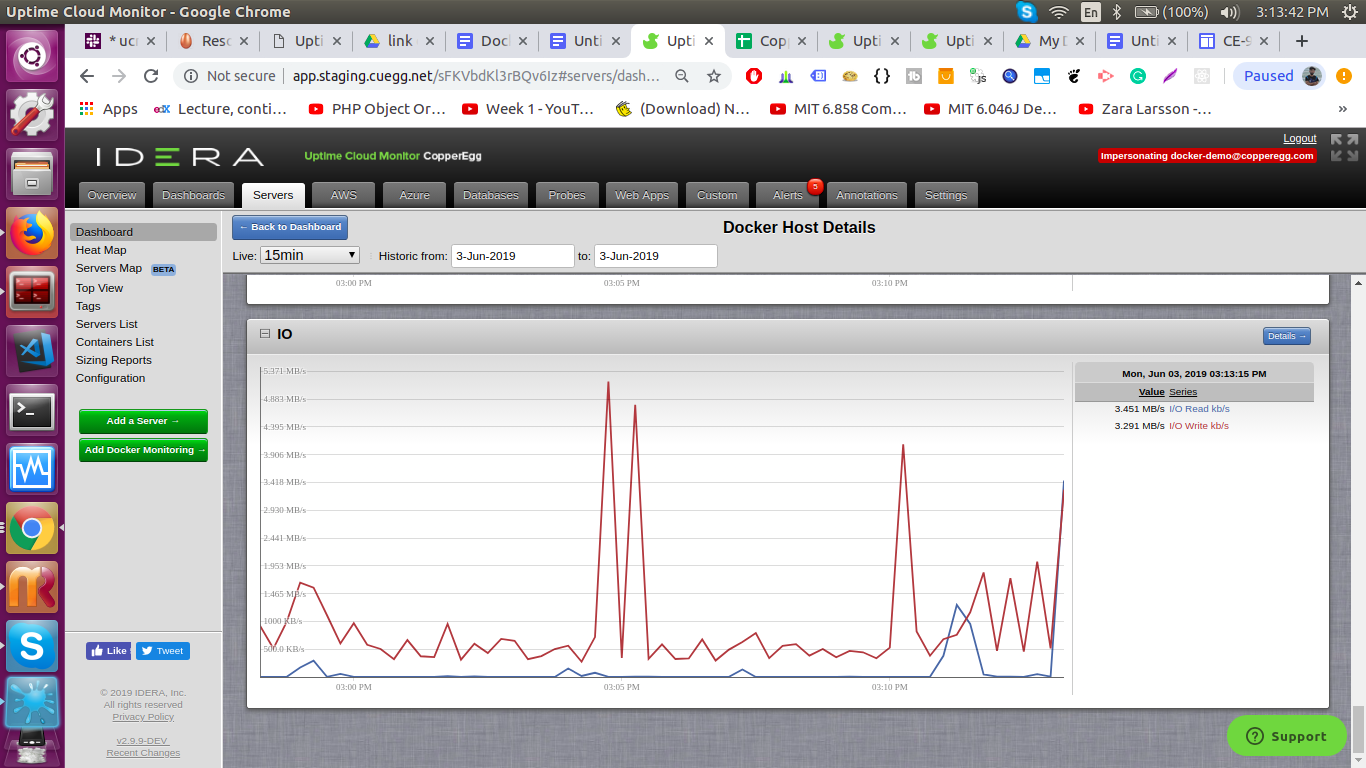
Figure 8: Widget inside Docker Host Tab displaying I/O metrics. 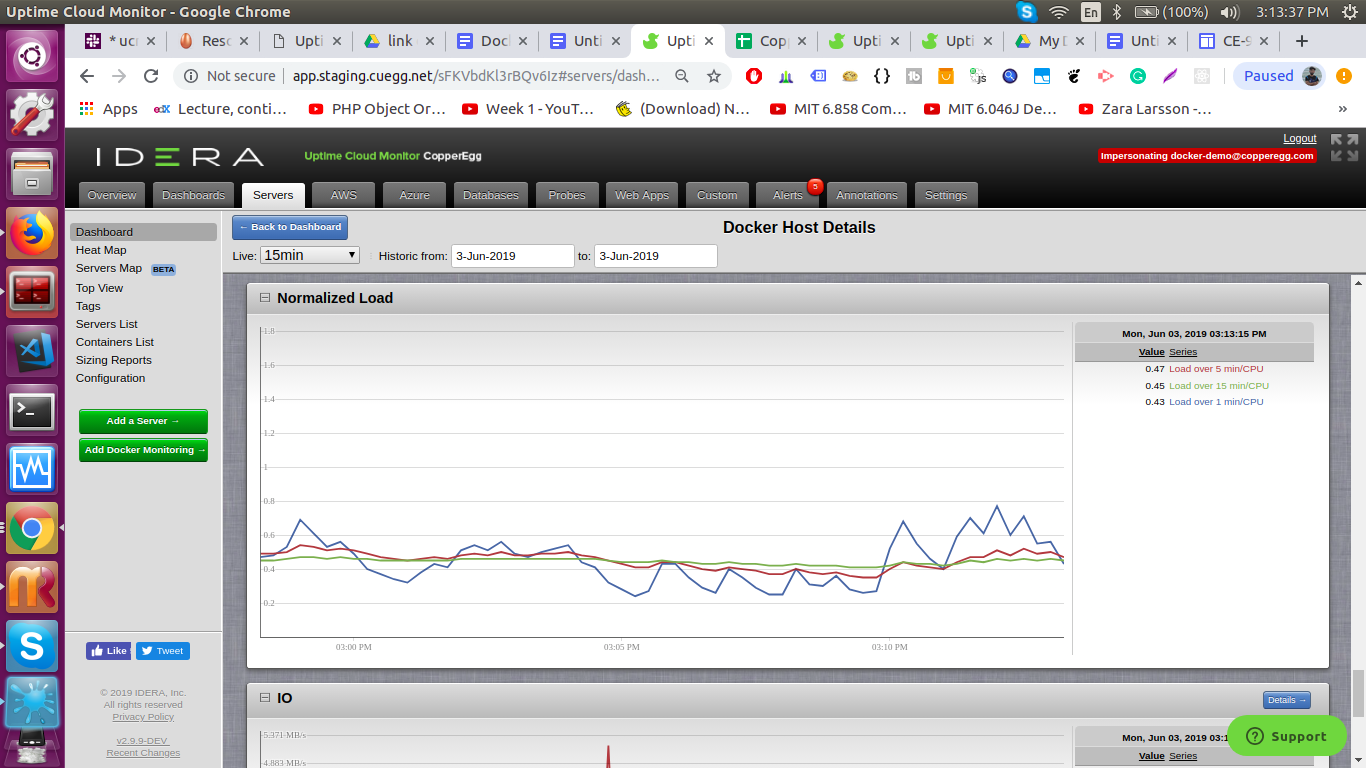
Figure 9: Widget inside Docker Host Tab displaying Normalized load over sort/med and large time interval.
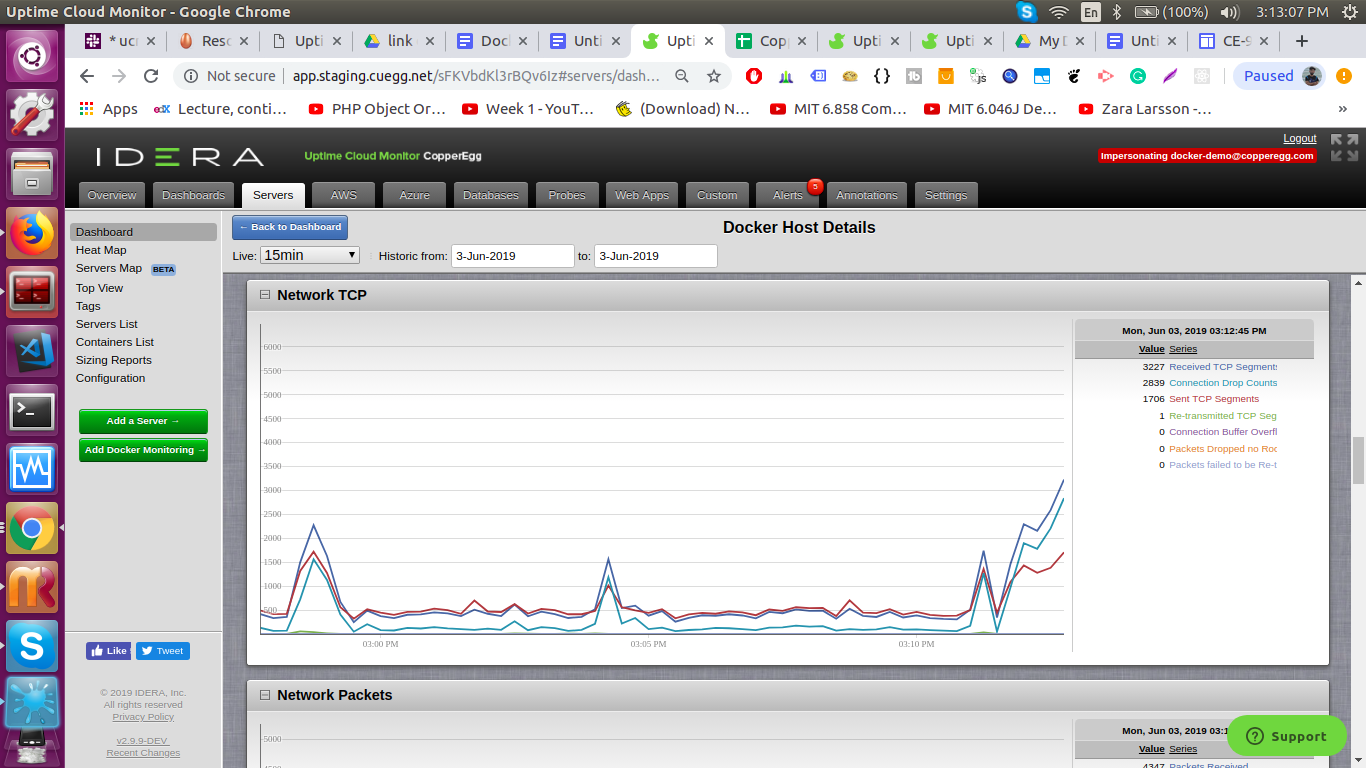
Figure 10: Widget inside Docker Host Tab displaying Network (TCP) related metrics.
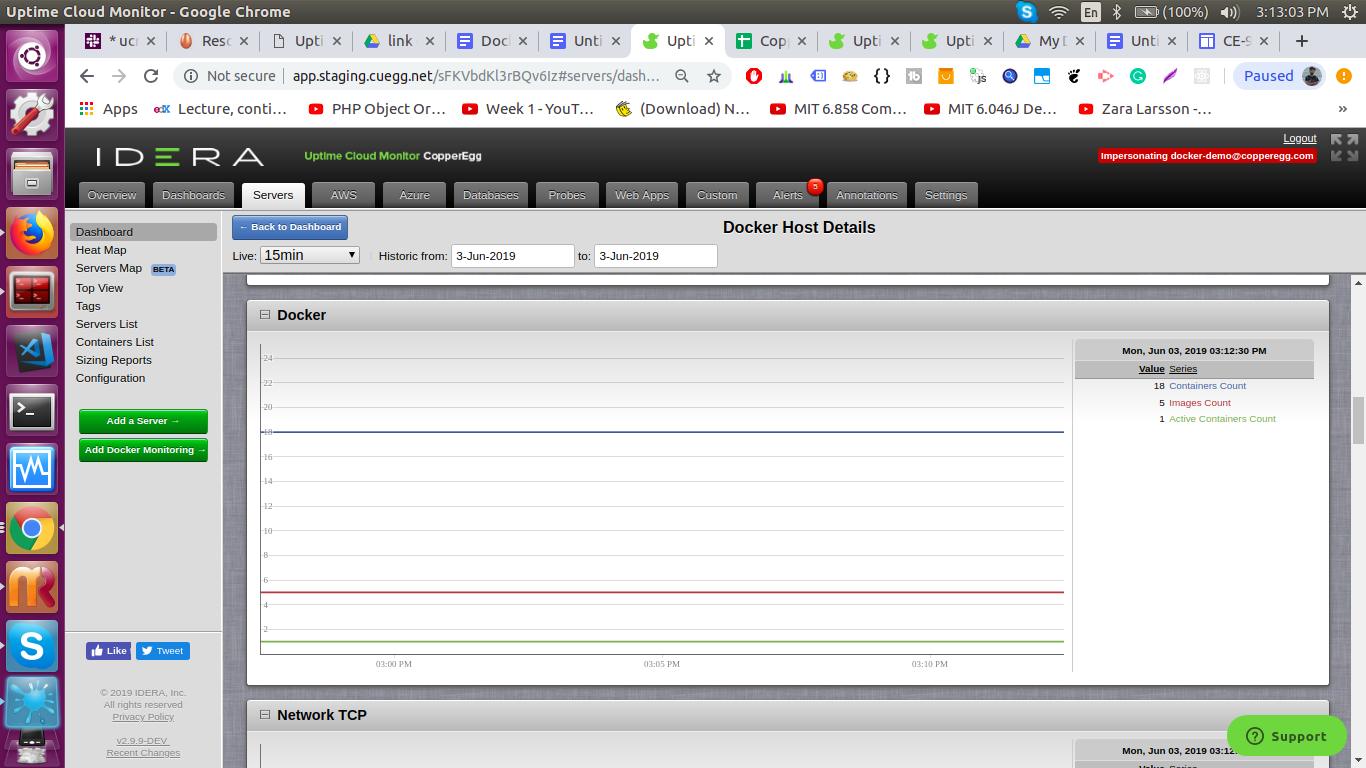
Figure 11: Widget inside Docker Host Tab displaying Docker related metrics like active containers/total containers etc.
Docker Container Metrics Tab
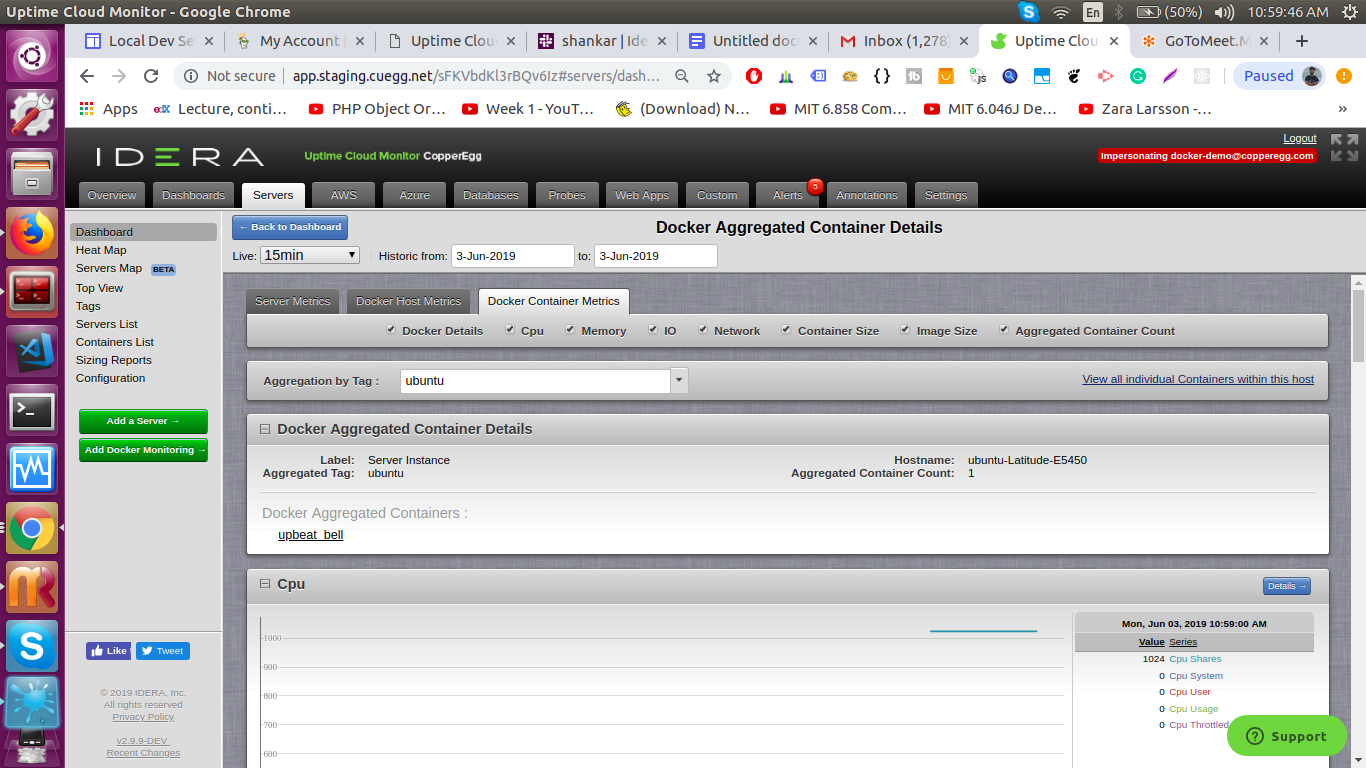
Figure 12: A Docker Container Metrics tab with charted metrics view.
As the installed script executes, you will notice data samples appearing on the widgets for this Dashboard as well as in the details page.
Here in Container Metrics tab you can see all the metrics of your docker containers aggregated by the tags applied to the containers. In order to see the detailed metrics of individual container you can go to container list from the left menu and click on details of individual container as shown.
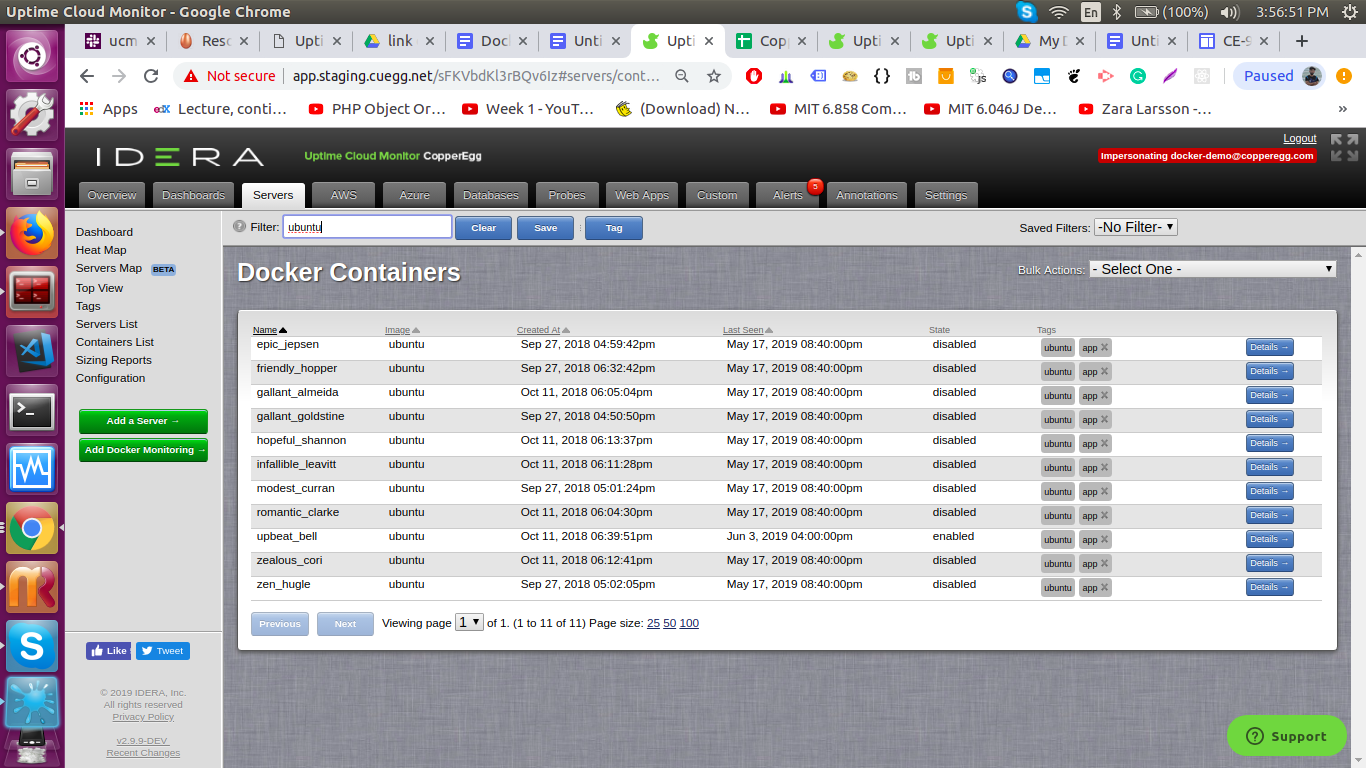
Figure 13: Container List page to see all container’s list for the particular site.
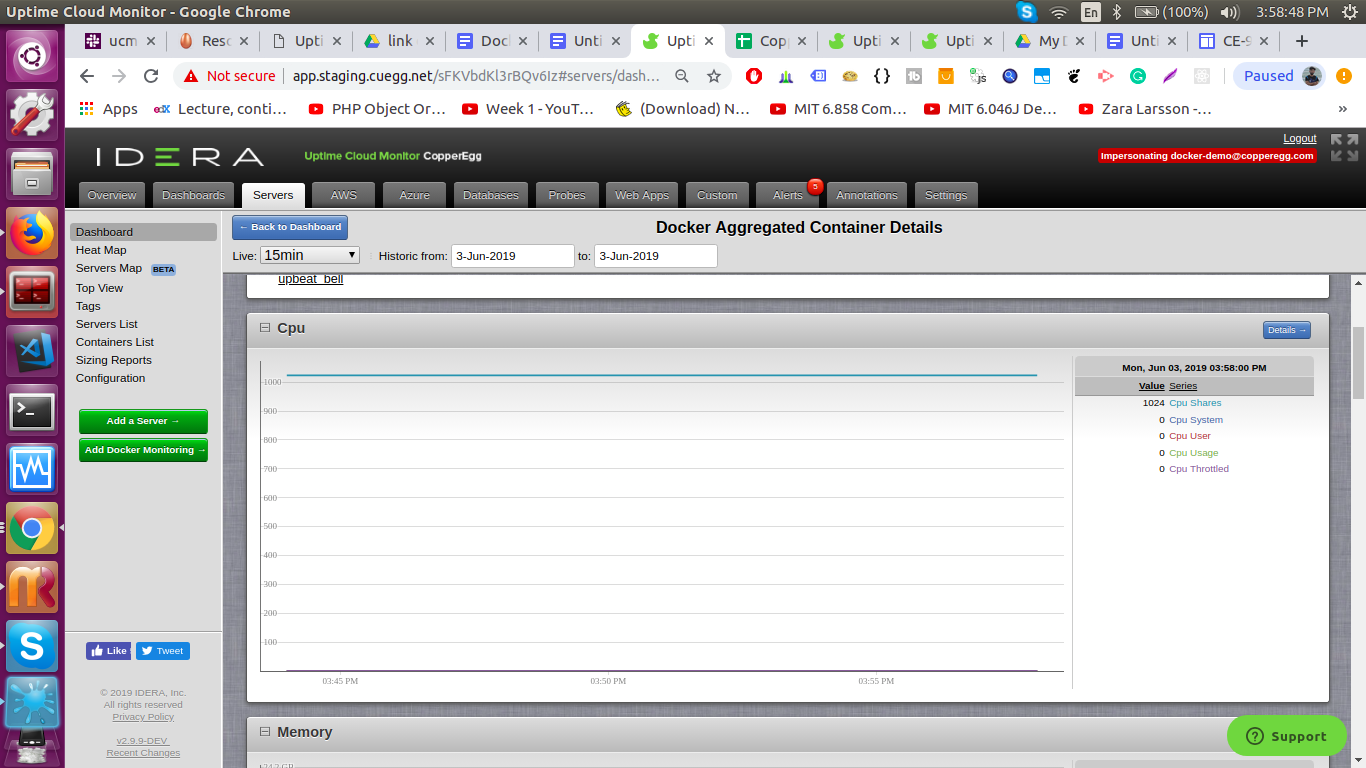
Figure 14: Widget inside Docker Containers Tab displaying CPU related Metrics for containers.
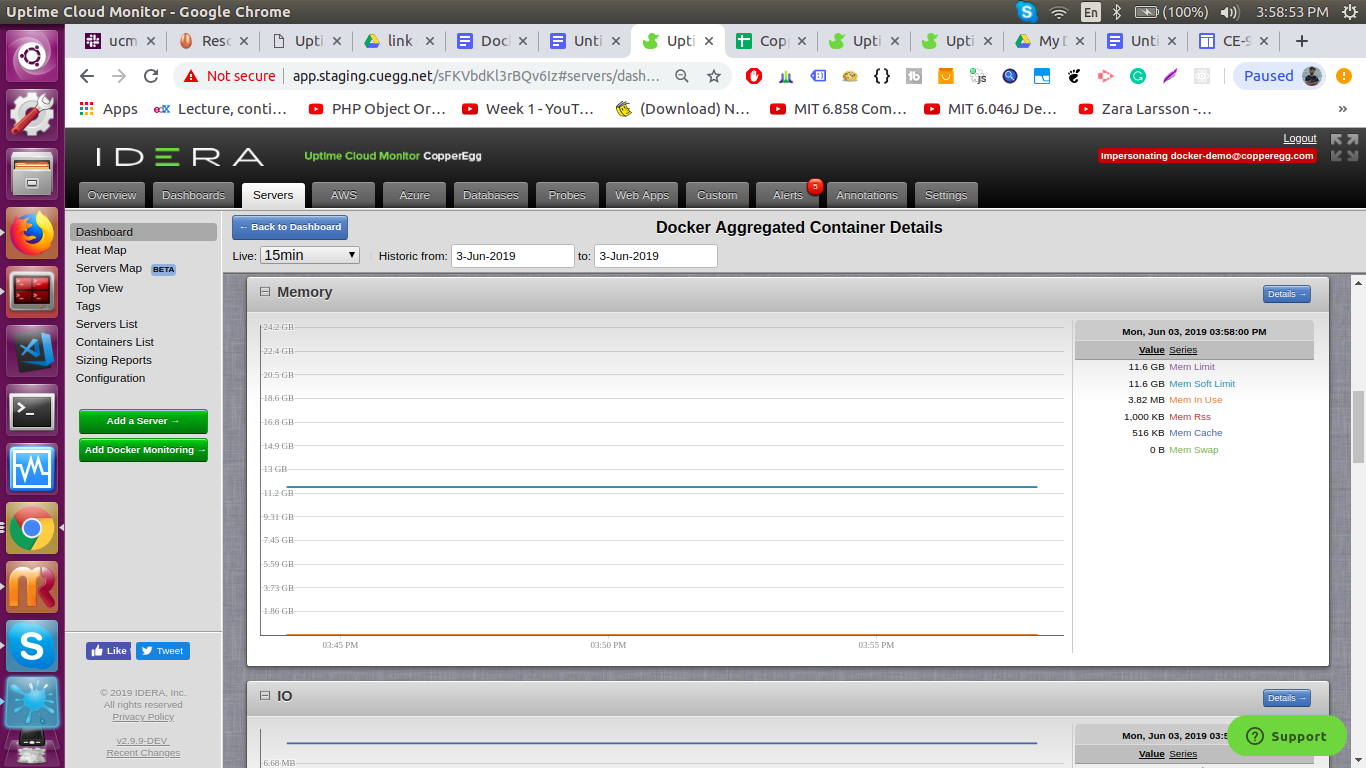
Figure 15: Widget inside Docker Containers Tab displaying Memory related Metrics for containers.
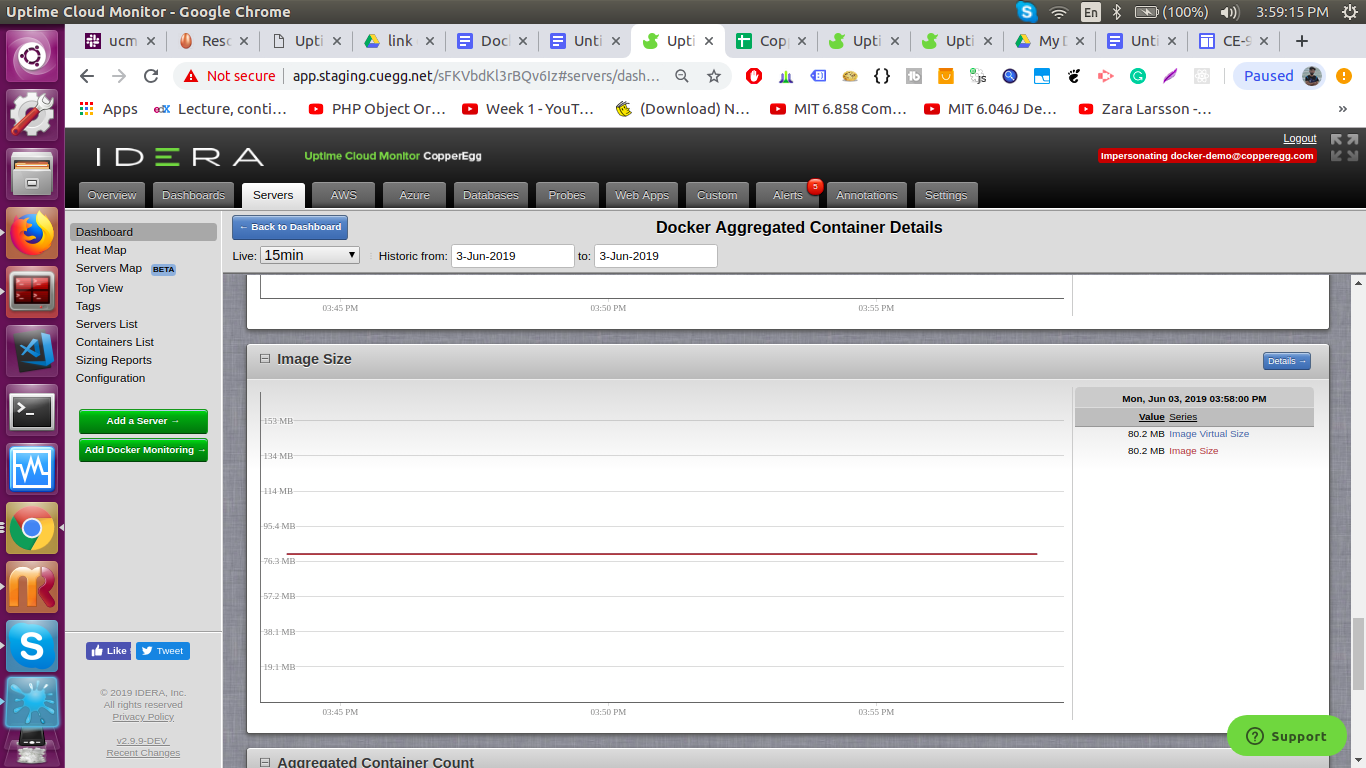
Figure 16: Widget inside Docker Container Tab displaying Image Size for a Container.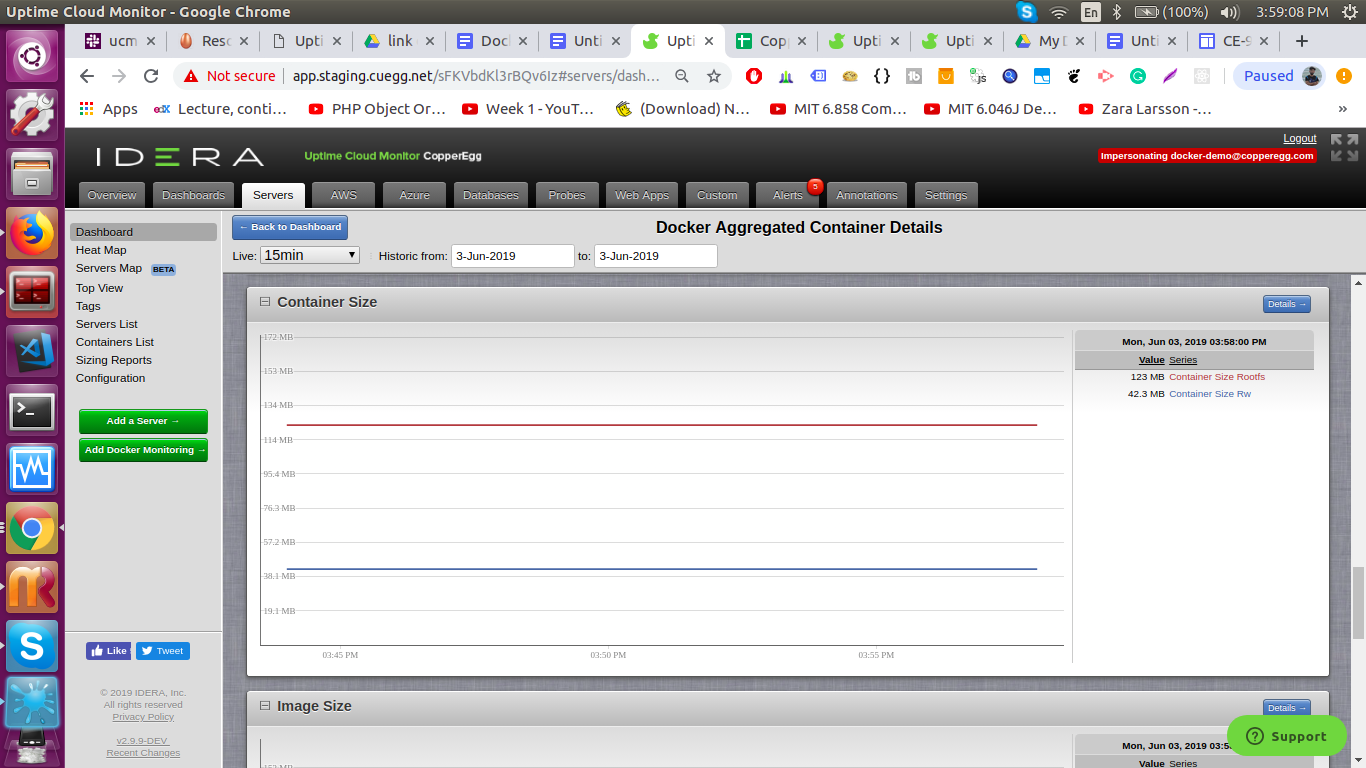
Figure 17: Widget inside Docker Containers Tab displaying Container Size related Metrics. Figure 18: Widget inside Docker Containers Tab displaying Network related Metrics for containers.
Monitored Metrics List
CopperEgg currently monitors 50 Docker Host Metrics and 19 Docker Container Metrics which cover most of the important metrics for Docker Host and Container from a performance and stability perspective.
The metrics are:
Docker Host Metric List
Inode Metrics:
File Handles in use – The amount of used allocated file handles over the system max.
Inodes Free – The number of free inodes.
Inode in Use – The number of inodes in use as a fraction of total.
Inodes Total – The total number of inodes.
Inodes Used – The number of inodes in use.
Requests(I/O) Metrics:
Request Size(Avg.) – Average request size of disk i/o requests
I/O Time(Avg.) – The average time for I/O requests issued to the device to be served. This includes the time spent by the requests in queue and the time spent servicing them.
I/O Read Time(Avg.) – The average time for read requests issued to the device to be served. This includes the time spent by the requests in queue and the time spent servicing them.
I/O Read Request/sec – The number of read requests issued to the device per second.
I/O Read kb/s – The number of kibibytes read from the device per second.
I/O Read Request Merged/sec – The number of read requests merged per second that were queued to the device.
I/O Reqest Service Time(Avg.) – The average service time for requests issued to the device.
I/O Request Issue Time(%) – The percent of CPU time during which I/O requests were issued to the device
I/O Write Time(Avg.) – The average time for write requests issued to the device to be served. This includes the time spent by the requests in queue and the time spent servicing them.
I/O Write Request/sec – The number of write requests issued to the device per second.
I/O Write kb/s – The number of kibibytes written to the device per second.
I/O Write Requests Merged/sec – The number of write requests merged per second that were queued to the device.
Normalized Load:
Load over 1 min/CPU – The average system load over one minute normalized by the number of CPUs.
Load over 5 min/CPU – The average system load over five minute normalized by the number of CPUs.
Load over 15 min/CPU – The average system load over fifteen minute normalized by the number of CPUs.
Memory Metrics:
Allocatable Memory – The total amount of memory currently available to be allocated on the system, based on the overcommit ratio.
Allocated Memory – The amount of memory presently allocated on the system, even if it has not been “used” by processes as of yet.
Shared Memory – The amount of physical RAM used as shared memory.
Memory used by kernel – The amount of memory used by the kernel to cache data structures for its own use.
Usable Memory – Sum total of free + buffered + cached memory
Swap Memory:
Swap Memory Cached – Amount of Swap Memory Cached
Swap Memory Used Fraction – Fraction of Swap Memory used
Swap Memory Used – Amount of Swap memory used
TCP Metrics:
Received TCP Segments – TCP Segments received in the interval
Sent TCP Segments – TCP Segments sent in the interval
Re-transmitted TCP Segments – TCP Segments re-transmitted in the interval
Connection Buffer Overflow Counts – The number of times connections have overflowed the accept buffer
Connection Drop Counts – Total number of times connections have dropped out of listen
Packets Dropped no Room in TCP Backlog – The number of packets dropped because there wasn’t room in the TCP backlog
Packets failed to be Re-transmitted – Total number of packets that failed to be retransmitted
Network Metrics:
Packets Received – The number of packets of data received by the interface.
Packet Receive Errors Count – The number of packet receive errors detected by the device driver.
Packets Sent – The number of packets of data transmitted by the interface.
Packets Sent Errors Count – The number of packet transmit errors detected by the device driver.
TCP ipv4 Metrics:
TCP ipv4 Connections Established Count – The number of TCP IPv4 established connections.
TCP ipv4 Listening Connections Count – The number of TCP IPv4 listening connections.
TCP ipv6 Metrics:
TCP ipv6 Connections Established Count – The number of TCP IPv6 established connections.
TCP ipv6 Listening Connections Count – The number of TCP IPv6 listening connections.
UDP Metrics:
UDP Datagrams Delivered to UDP users – The number of UDP datagrams delivered to UDP users
UDP Datagrams Failed to be Delivered to UDP users – The number of received UDP datagrams that could not be delivered for reasons other than the lack of an application at the destination port
UDP Datagrams Sent – Total number of UDP datagrams sent from this entity
UDP Datagrams Lost Due to No Room in Receive Buffer – Total number of UDP datagrams lost because there was no room in the receive buffer
UDP Datagrams Lost Due to No Room in Sent Buffer – Total number of UDP datagrams lost because there was no room in the send buffer
Host stats metrics:
Containers Count – Total number of available Containers
Images Count – Total number of images available
Active Containers Count – Total number of running containers
Docker Container Metric List
CPU Metrics:
Cpu System – The percent of time the CPU is executing system calls on behalf of processes of container, unnormalized
Cpu User – The percent of time the CPU is under direct control of processes of container, unnormalized
Cpu Usage – The percent of CPU time obtained by this container
Cpu Throttled – Number of times the cgroup has been throttled
Cpu Shares – Shares of CPU usage allocated to the container
Memory Metrics:
Mem Cache – The amount of memory that is being used to cache data from disk
Mem Rss – The amount of non-cache memory that belongs to the container’s processes.
Mem Swap – The amount of swap currently used by the container
Mem Limit – The memory limit for the container, if set
Mem Soft Limit – The memory reservation limit for the container, if set
Mem In Use – The fraction of used memory to available memory, IF THE LIMIT IS SET
Disk IO:
Io Read Bytes – Bytes read per second from disk by the processes of the container
Io Write Bytes – Bytes written per second to disk by the processes of the container
Network:
Net Bytes Rcvd – Bytes received per second from the network
Net Bytes Sent – Bytes sent per second from the network
Container Specific:
Container Size Rw – Total size of all the files in the container which have been created or changed by processes running in the container
Container Size Rootfs – Total size of all the files in the container
Image Virtual Size – Size of all layers of the image on disk
Image Size – Size of Image
More details on these metrics can be obtained here.
3.Configure Alerts to be notified about Docker Host/Container’s performance issues
Configuring your own Alerts for the Docker Host
- Alerts can be added on Docker Host, Docker Container and Aggregated Docker Container’s data to get notified on various critical states your infrastructure undergoes. These alerts are applied on the bases of tags applied to your docker host or containers.
For Aggregated Docker Containers there is a support for two level selector for containers i.e first select the matching docker host and then match the containers by tag in those matching docker hosts.Sample Alerts :Scenario 1 (Docker Host Alert) : If the ‘Inodes in use’ of all Docker Hosts having some tag say ‘t1’ exceeds 90% consistently over the past 30 mins, alert can be triggered. This alert will check for all the docker hosts having tag ‘t’ for the configured alert.Scenario 2 (Docker Container Alert) : If the ‘Inodes in use’ of all Docker Hosts having some tag say ‘t1’ exceeds 90% consistently over the past 30 mins, alert can be triggered. This alert will check for all the docker hosts having tag ‘t’ for the configured alert.Scenario 3 (Docker Aggregated Container Alert) : If the ‘Inodes in use’ of all Docker Hosts having some tag say ‘t1’ exceeds 90% consistently over the past 30 mins, alert can be triggered. This alert will check for all the docker hosts having tag ‘t’ for the configured alert.
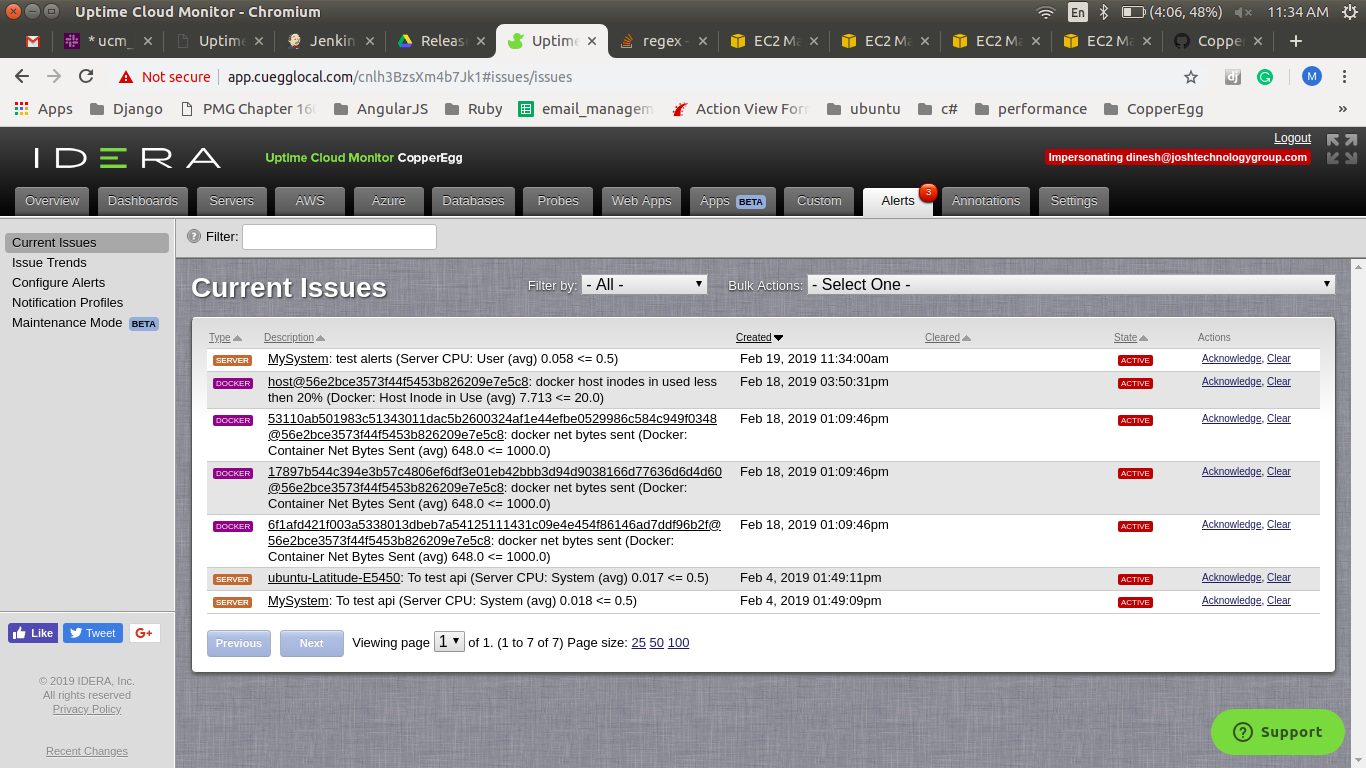
Figure 19: Alerts Notifications for docker host/containers on the alerts tab.
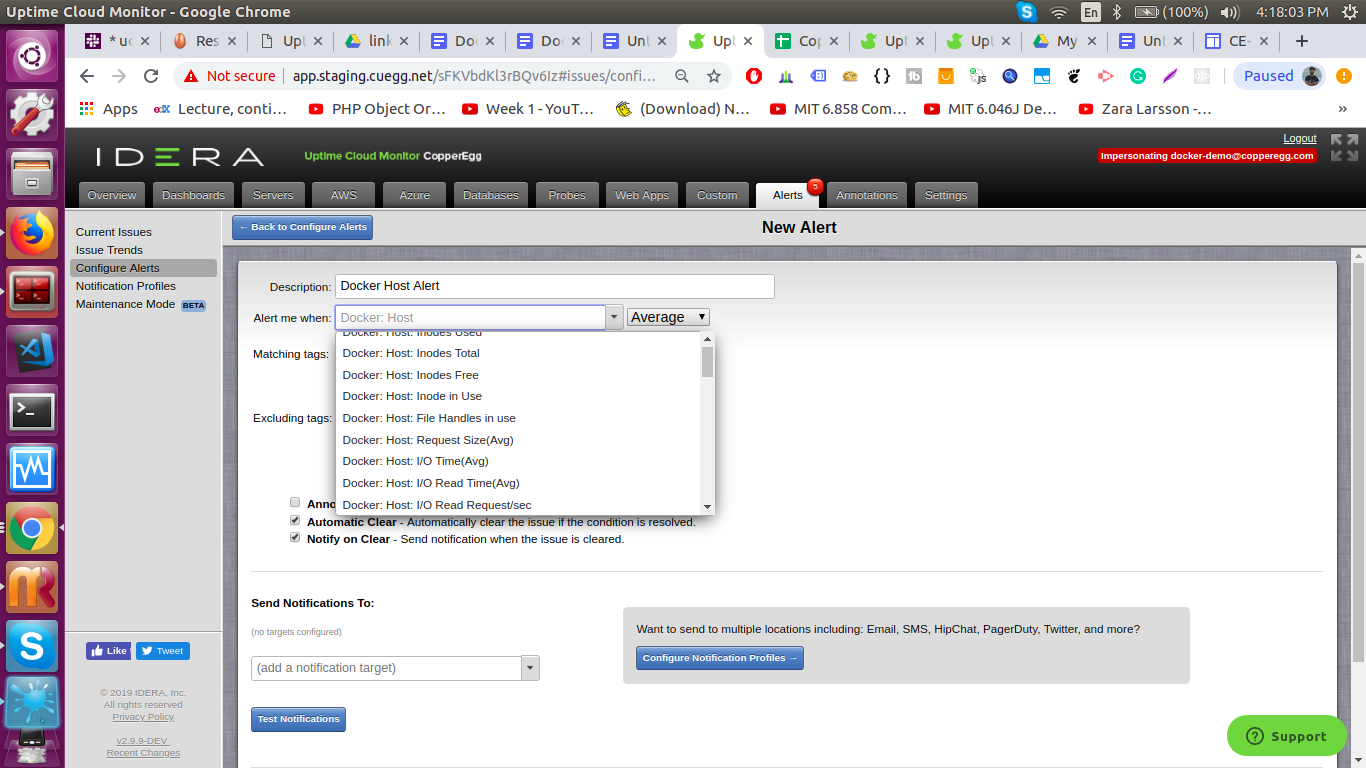
Figure 20: Creating Alert Definition for docker Host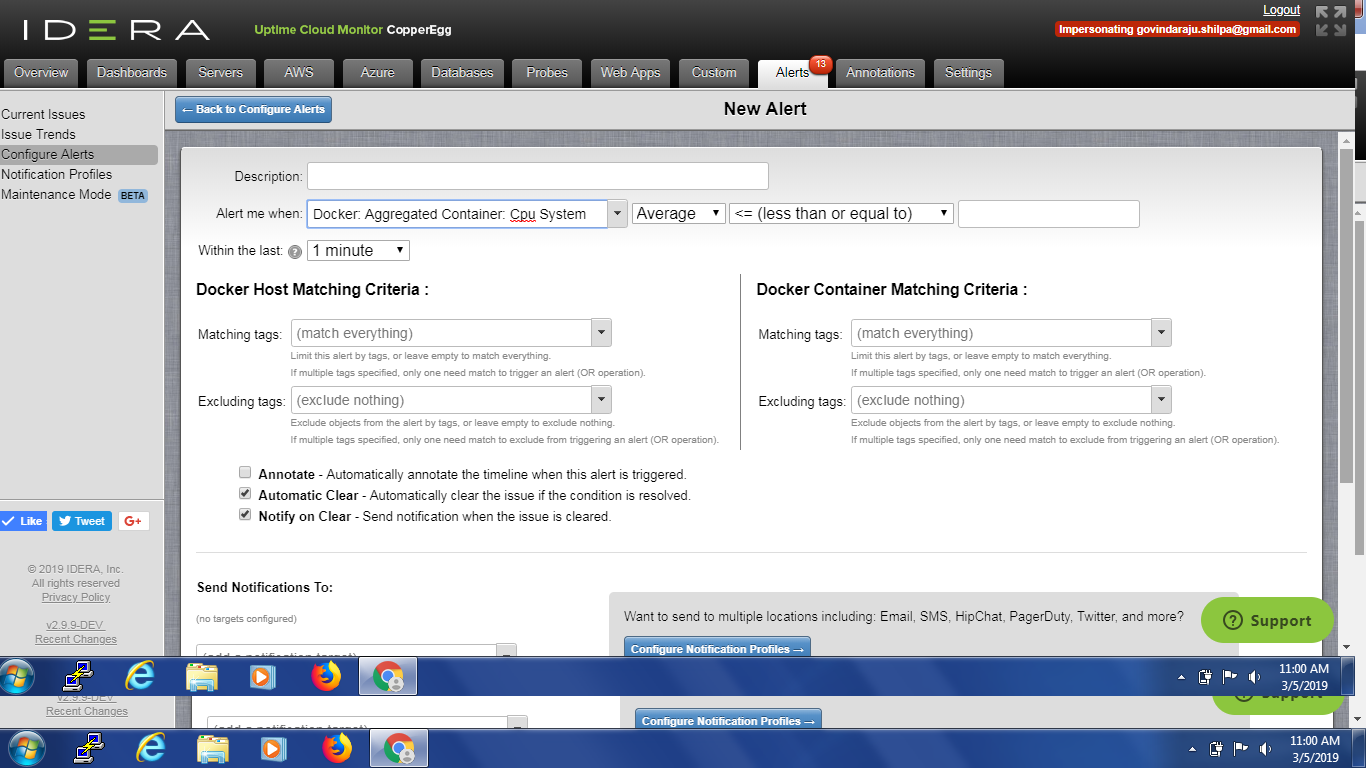
Figure 21: Creating Alert Definition for docker Containers.
Alerts can also be configured against any of these 50 + 19 monitored metrics for Docker Host/Containers and Aggregated containers as well
You can configure new alerts that will be triggered when performance issues with Docker Host/Containers arise. You can also configure the notification mechanisms for a triggered alert.
- Go to Alerts Tab > Configure alerts and click on “New Alerts” button
- Provide values for these fields in the New Alert page:
- Description: A description of the alert that will be easily recognized by you and your team if the alert is triggered
- Alert me when: Select the metric of interest and the condition upon which the alert is triggered. In the Alert me when dropdown, you can prefill “Docker Host/Container/Aggregated Container: <your Docker Metric Group Name>” to get only the list of monitored metrics for your specific Docker Object. From this list, you can then select the specific metric for which you want to configure an alert.
- For at least: The duration for which the alert condition must be valid for the alert to be triggered
- Matching tags: By default, (match everything) is chosen. If needed, you can attach tags to a particular metric object and select those tags here, which would cause only alerts on that metric object to be triggered.
- Excluding tags: By default, (exclude nothing) is chosen. If needed, you can attach tags to a particular metric object and select those tags here, which would cause alerts on that metric object to be skipped.
- Annotate: When enabled, an annotation is automatically created when the alert is triggered. Annotations will be visible in the custom metrics dashboard where the data stream is displayed.
- Automatic Clear: When enabled, the alert issue is automatically cleared if the triggering condition is no longer true
- Notify on clear: When enabled, notifications are also sent when the alert issue is cleared. Please do note that notifications are always sent when the alert issue is triggered.
- Send Notifications To: Here you can configure the notification mechanisms by which the alert is communicated to you and others in your team.
Note : As Mentioned in case of configuring alert for docker container you can also filter the container selection based on docker host so you can also match the docker host by including/excluding tags criteria.
CopperEgg supports notifying different sets of users with differing notification mechanisms for each alert type.
Notification mechanisms include:
- SMS
- PagerDuty
- HipChat
- Campfire
- Slack
- OpsGenie
Webhooks are also exposed for clients to configure custom notification mechanisms.
4. Custom Dashboard Widgets to view more detailed graphs
- Create your own Custom Dashboards to display all the monitored data aggregated across your Docker Host and Aggregated Docker Containers
This is an important feature to get the graphical view of charts of a particular metric group from different sources. This is helpful in comparison of a metric across different sources.
Scenario : Suppose you have different type of application server running as a containers on different instances. And you want to view the combined memory usage for each instance of app server. This can be done by tagging app containers as some tag say ‘t1’ and then create a custom dashboard widget for matching container tag as ‘t1’ and matching host tag as ‘app-server’.
.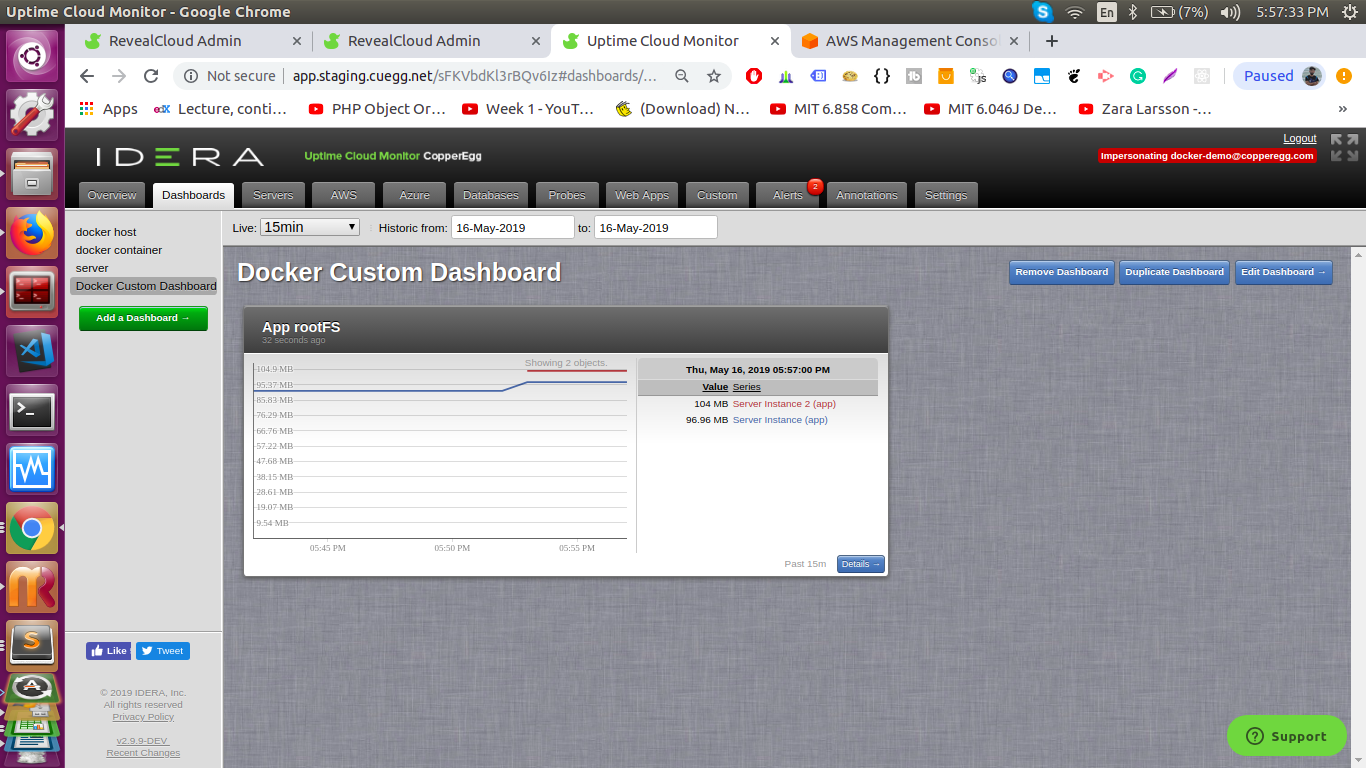
Figure 22: Docker Container Custom Data Widget.
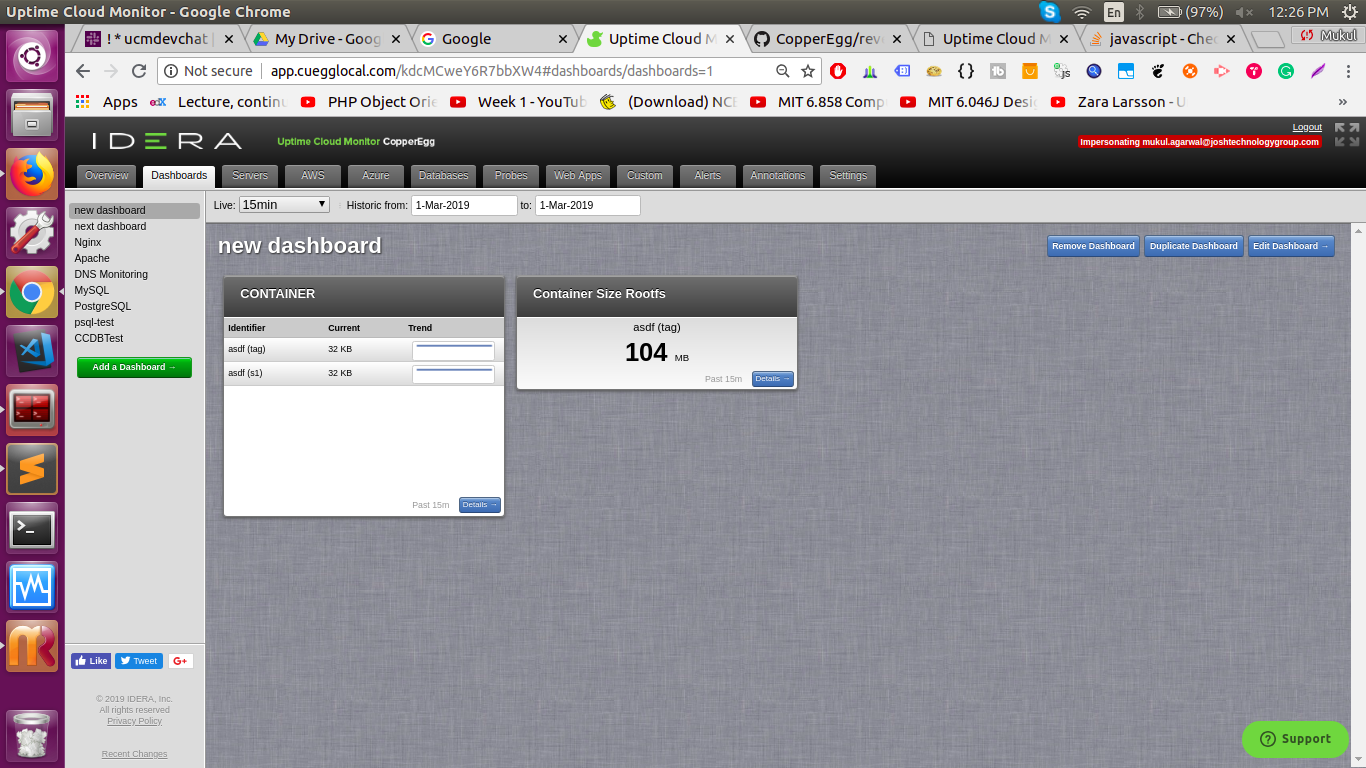
Figure 23: Custom Widget example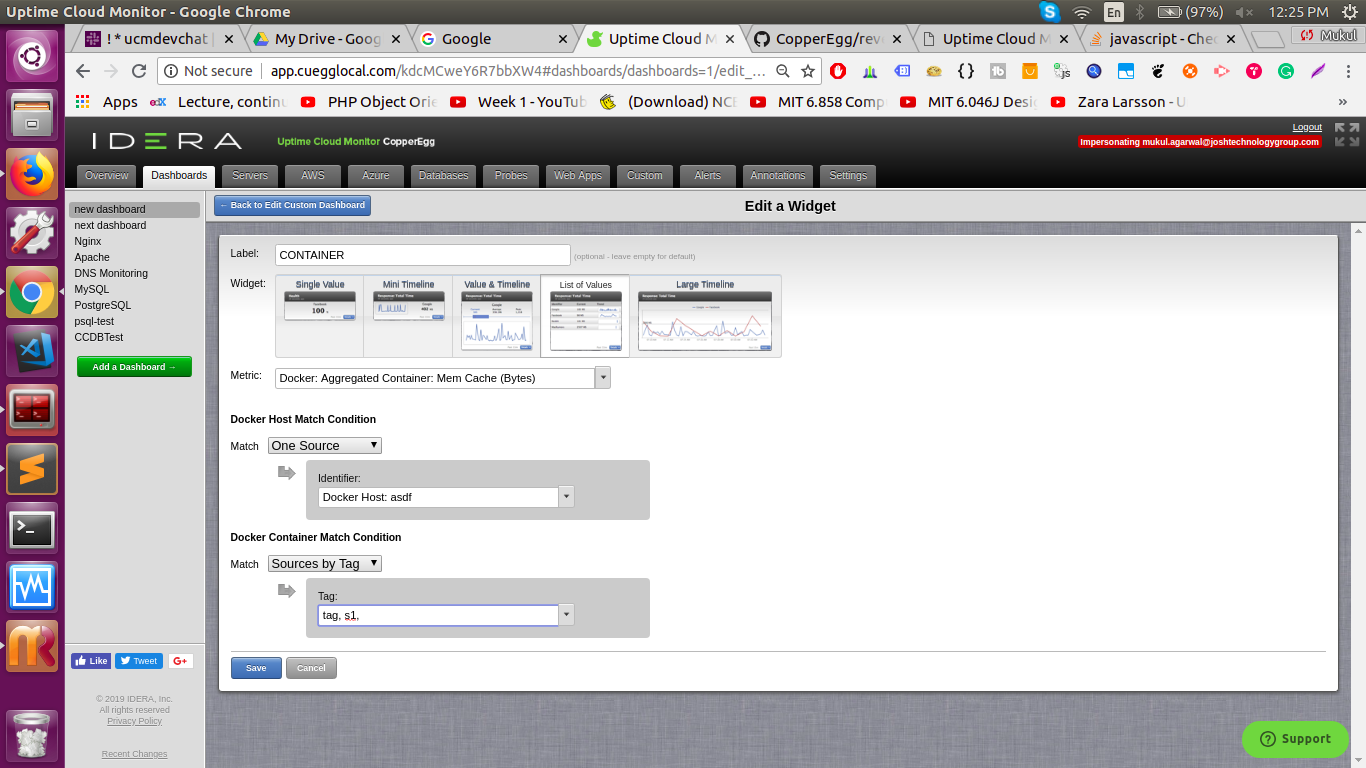
Figure 24: Docker Container Custom widget creation page.
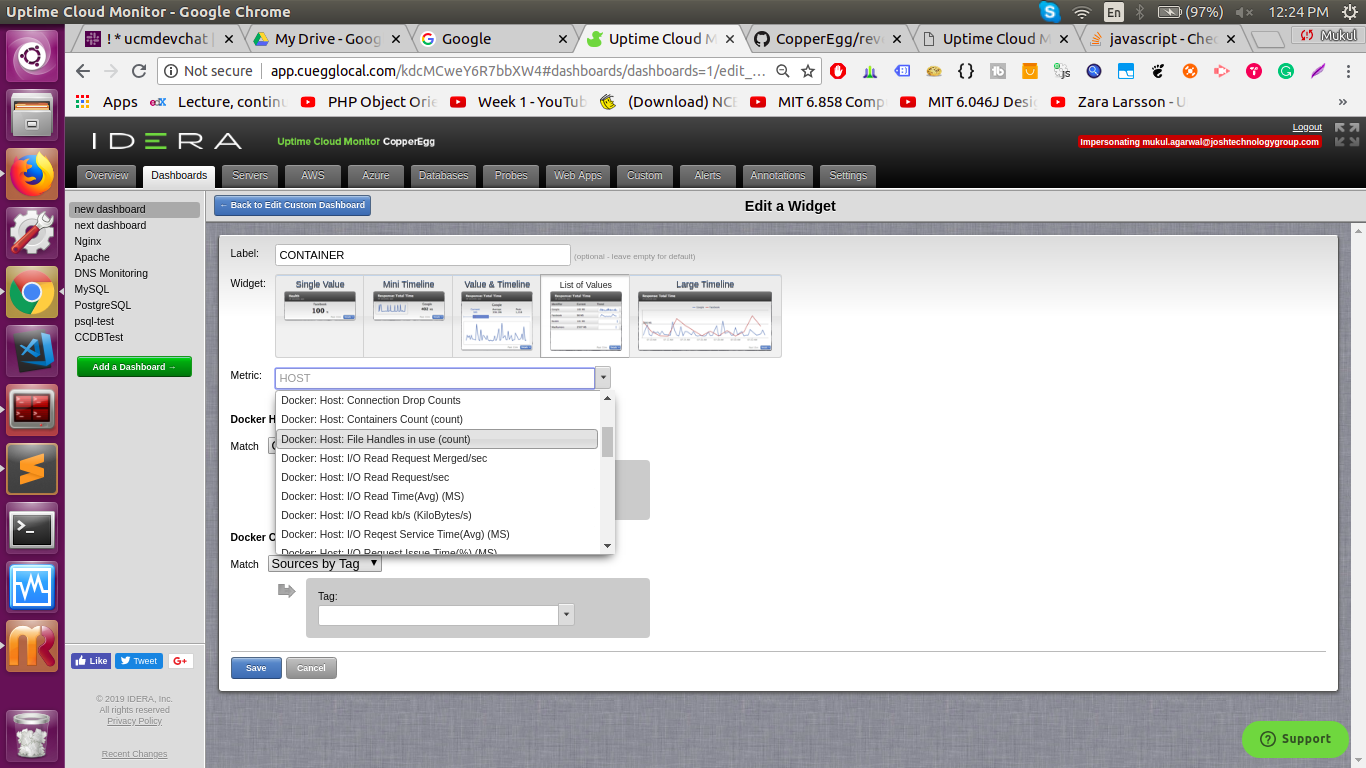
Figure 25: Adding Docker Host/Container Widget in custom dashboard.
Start monitoring your docker Host/Container on CopperEgg today :
Start your CopperEgg trial today and start monitoring your docker Host / Containers follow these steps and get your Monitoring agent up and running. Also if you are already monitoring your infrastructure using our standard or pro monitoring agent just add a default `docker` tag to those instances to enable docker monitoring.
You can create a CopperEgg trial account using this link to start monitoring your infrastructure.