Monitor Redis for Performance and Availability
Are you using Redis in your application? You can use IDERA Uptime Cloud Monitor(UCM) to monitor your Redis performance. As an illustration, you can configure and receive alerts for the following scenarios:
- Performance: alert if the Redis performance is poor.
- If the used_cpu_user value is significantly above its normal range, that would imply that the Redis is under heavy load.
Prerequisites
Uptime Cloud Monitor from IDERA offers a SAAS based out-of-the-box monitoring solution for Redis that is easy to set up. If you are not familiar with the concept of custom metrics as used in Uptime Cloud Monitor, please go through Custom Metrics information once before continuing with this document.
- Uptime Cloud Monitor account.
If you don’t already have an account, you can sign up for a 14 day FREE TRIAL of Uptime Cloud Monitor here (no Credit Card required).
- Redis is up and running in your environment.
- Root access to server to install the Redis agent.
Monitor Redis using out-of-the-box custom metrics installer from Uptime Cloud Monitor
There are three steps that you need to do to start monitoring a Redis server:
- Redis Agent Installation
- Verify that your Redis Dashboard is up and running
- Configure alerts to be notified about Redis performance issues
1.Redis Agent Installation
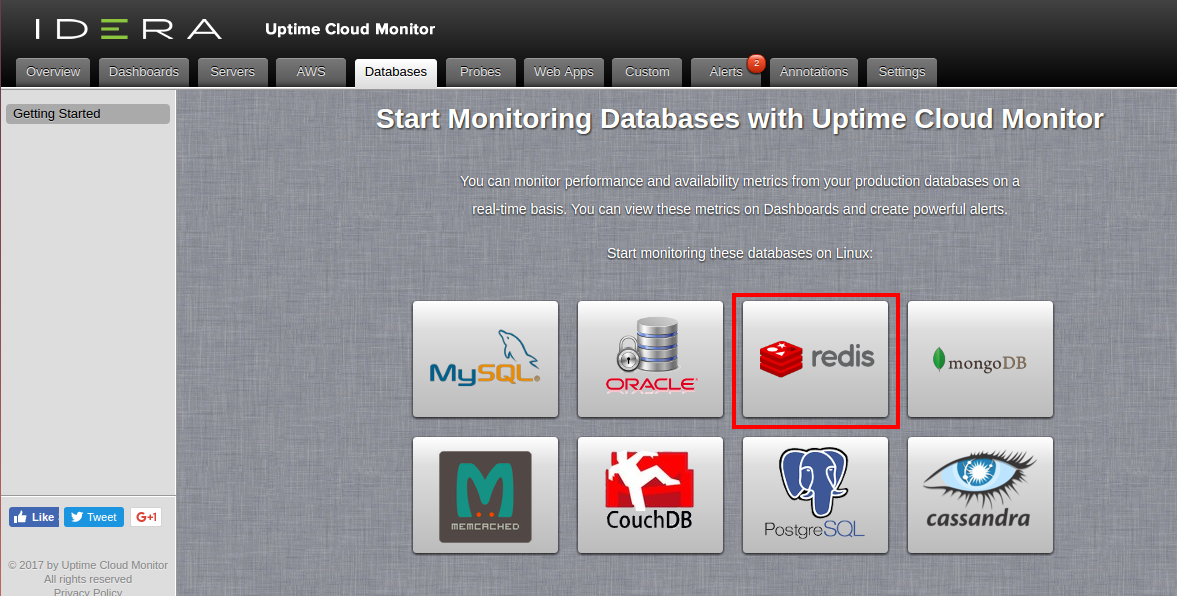
Figure 1: In your Uptime Cloud Monitor Account, navigate to Databases>Getting Started
Login to your Uptime Cloud Monitor account and navigate to Custom tab -> Getting Started. Click on Redis icon.  .
.
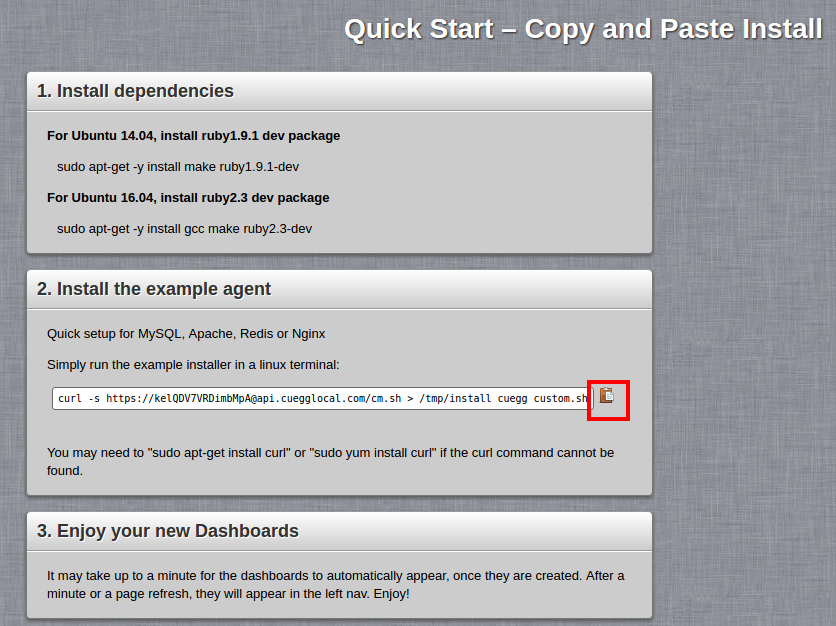
Figure 2: The Redis agent installation script
Click on ![]() icon to copy the installer script to your clipboard. Paste the command into the terminal window on the server where you want to install the agent. Script can be run on the server running Redis, or it can be a different server, but this server will need to be continually running in order to monitor Redis.
icon to copy the installer script to your clipboard. Paste the command into the terminal window on the server where you want to install the agent. Script can be run on the server running Redis, or it can be a different server, but this server will need to be continually running in order to monitor Redis.
As soon as the script is run on a terminal with root access, it starts downloading the required Redis monitoring agent on your server. You will need to configure the following items in the agent installation process. Item specified in square brackets ( [ ] ) are the default.
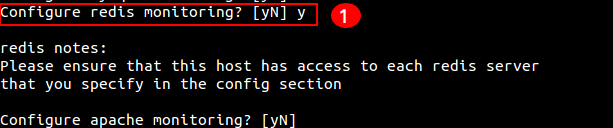
Figure 3: Executing the Redis agent installation script
- Press y to monitor Redis.
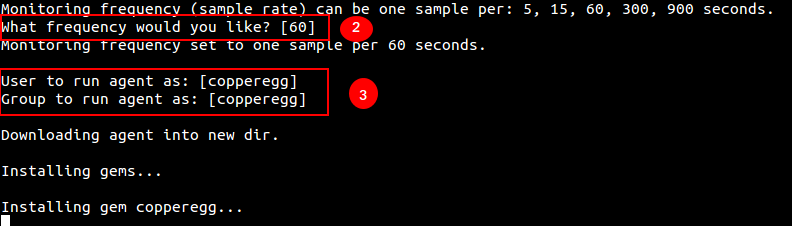
Figure 4: Executing the Redis agent installation script with user as copperegg, Group as copperegg and monitoring frequency as 15 seconds
- Monitoring frequency: 15, [60], 300, 900, 3600 seconds
- User and Group for running service as default values: [copperegg][copperegg]
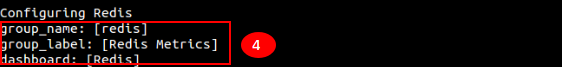
Figure 5: Executing the Redis agent installation script with group name as “Redis”, group label as “Redis Metrics” and Dashboard as “Redis”
- Group label, group name and dashboard name for custom metrics [Redis][Redis Metrics][Redis]
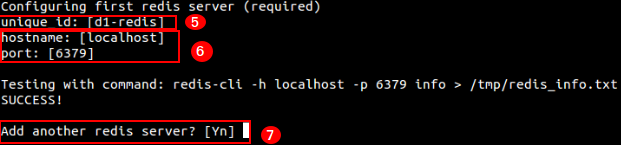
Figure 6: Executing the Redis agent installation script with unique id, server hostname and port. Only one Redis server is added for monitoring.
- Unique name for this node (good to differentiate if you are monitoring different Redis databases). [<user>-Redis]
- Server details : hostname and port for service. [localhost][6379]
- After configuring one database, you’ll get an option to add more Redis server.
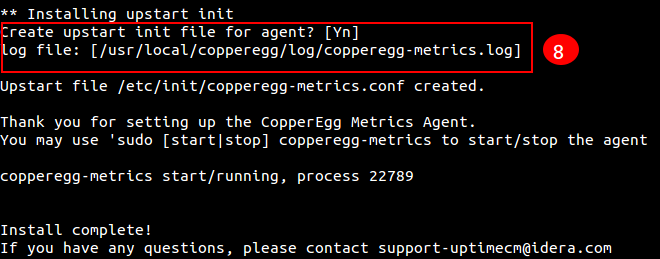
Figure 7: Executing the Redis agent installation script with an upstart init file and the default value for log file name. The installation completes successfully!
- Configure log file name and upstart job name (defaults present) [/usr/local/copperegg/log/copperegg-metrics.log][/etc/init/copperegg-metrics.conf]
2.Verify that your Redis Dashboard is up and running
Navigate to Dashboard and you will see a new Redis Dashboard has been added automatically by the installer.
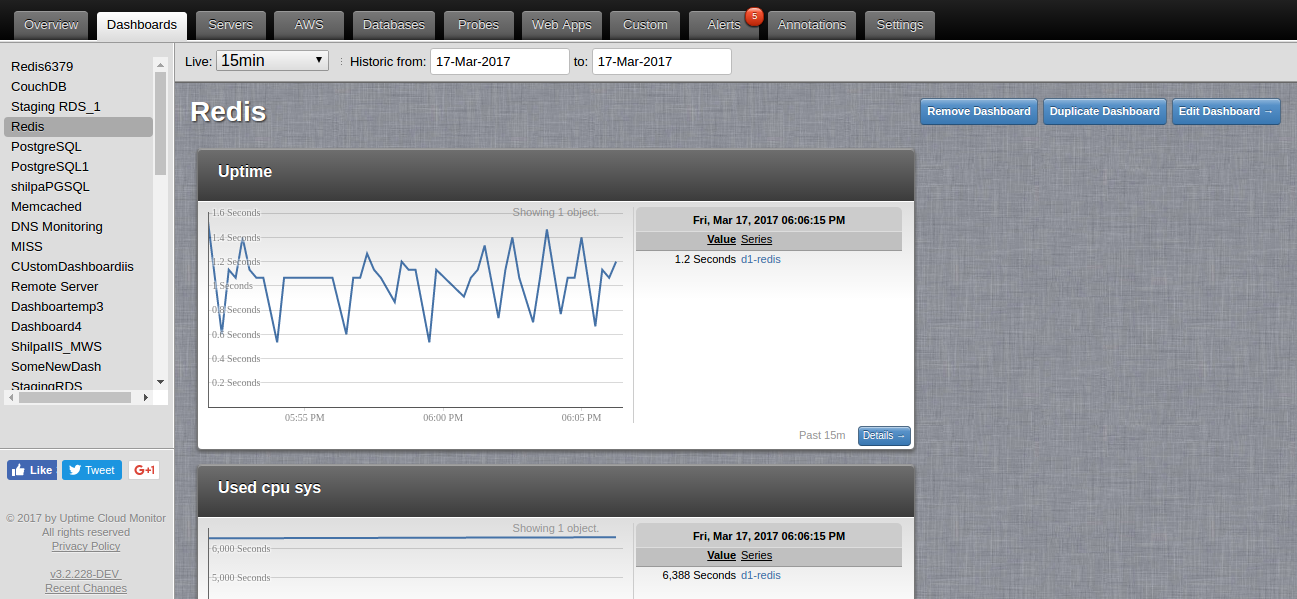
Figure 8: A new Dashboard for Redis has been added
As the installed script executes, you will notice data samples appearing on the widgets for this Dashboard.
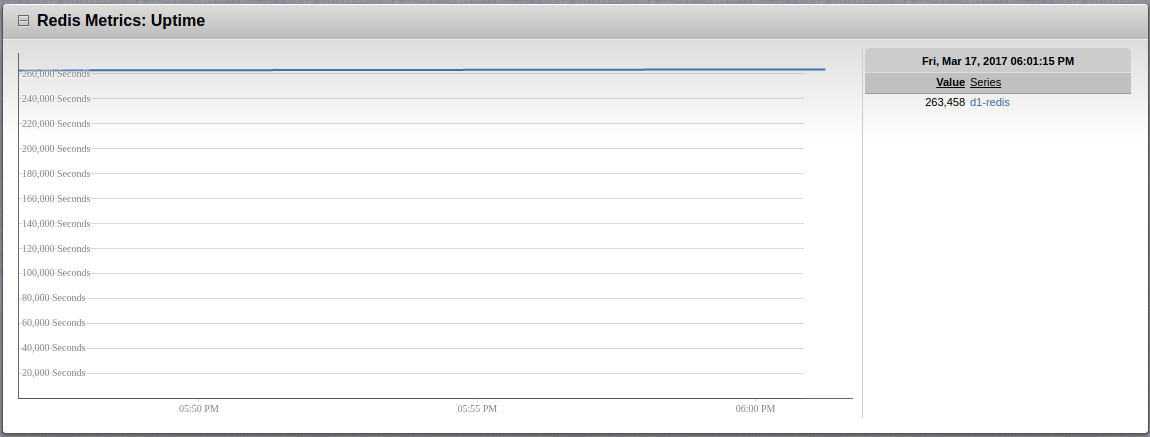
Figure 9: Widget inside Redis Dashboard displaying Uptime.
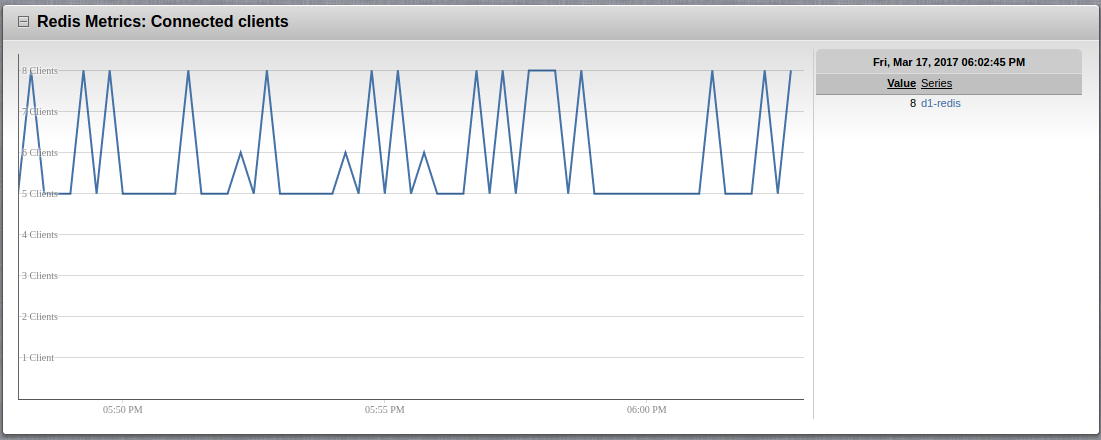
Figure 10: Widget inside Redis Dashboard displaying connected clients.
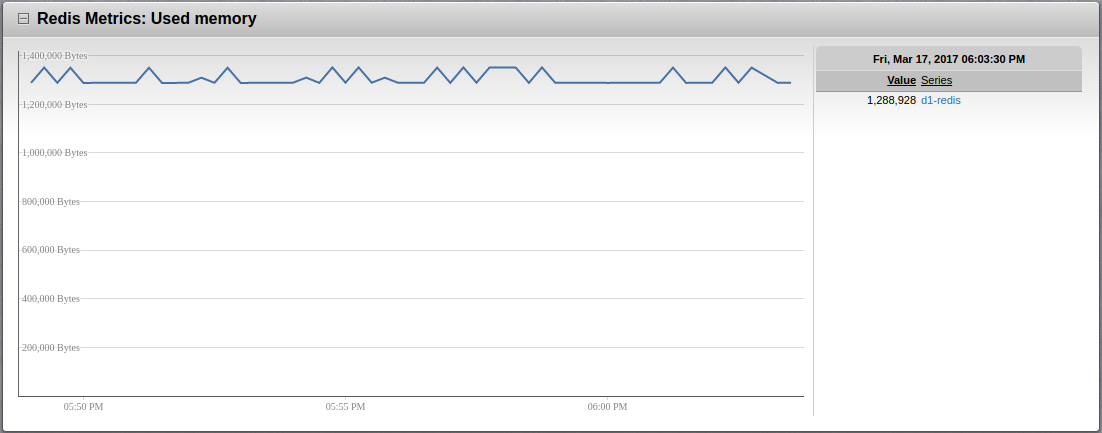
Figure 11: Widget inside Redis Dashboard displaying used memory.
Monitored metrics
Uptime Cloud Monitor currently monitors 22 metrics which cover most of the important metrics for Redis from a performance and stability perspective. You can see these 22 metrics by navigating to the Custom Tab > Custom Objects and selecting Details on the Custom Metrics Group Label [Redis Metrics] that was given as installation input. For some of these metrics, alerts have been automatically created (see section 3 below). To create new alerts see section: Configuring your own Alerts for Redis Database.
The metrics are:
- uptime : Uptime
- used_cpu_sys : Used cpu sys
- used_cpu_user : Used cpu user
- connected_clients : Connected clients (alert automatically created)
- connected_slaves : Connected slaves
- blocked_clients : Blocked clients
- used_memory : Used memory
- used_memory_rss : Used memory rss (alert automatically created)
- used_memory_peak : Used memory peak
- mem_fragmentation_ratio : Mem fragmentation ratio
- Changes_since_last_save : Changes since last save
- Total_connections_received : Total connections received
- Total_commands_processed : Total commands processed
- Expired_keys : Expired keys
- Keyspace_hits : Keyspace hits
- Keyspace_misses : Keyspace misses
- Pubsub_channels : Pubsub channels
- Pubsub_patterns : Pubsub patterns
- Latest_fork_usec : Latest fork usec
- Keys : Keys
- Evicted_keys : Evicted keys
- Expires : Expires
3.Configure Alerts to be notified about Redis performance issues
Default Pre-Configured Alerts for the Redis Database
As soon as your Redis Database Monitoring Dashboard comes up, you will notice that some alert configurations have been automatically created by our Installation Script (under Alerts > Configure Alerts). These pre-configured alerts for Redis Database include:
| Sr. No. | Metric Name | Definition | Alert Definitions | Duration |
| 1 | Connected clients | The number of connected clients (excluding slaves) | Alert will be triggered if connected clients reach 8000. | 3 Min |
| 2 | User memory RSS | Amount of memory that Redis allocated as seen by the os |
|
3 Min |
If the alerting condition is met for these pre-configured alerts, some alert notifications may also be triggered.
Configuring your own Alerts for the Redis Database
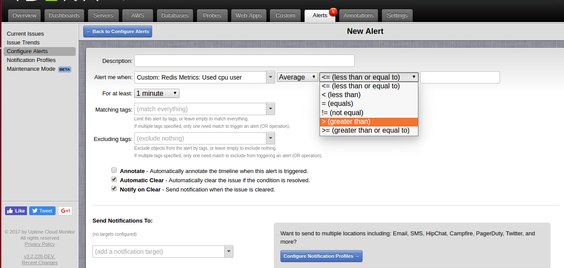
Figure 12: A new alert being added that will be triggered when Redis used_cpu_user metric exceeds a threshold of <entered value> within a time period of 1 min
Alerts can also be configured against any of these 22 monitored metrics for Redis.
You can configure new alerts that will be triggered when performance issues with Redis arise. You can also configure the notification mechanisms for a triggered alert.
- Go to Alerts Tab > Configure alerts and click on “New Alerts” button
- Provide values for these fields in the New Alert page:
- Description: A description of the alert that will be easily recognized by you and your team if the alert is triggered
- Alert me when: Select the metric of interest and the condition upon which the alert is triggered. In the Alert me when dropdown, you can prefill “Custom: <your Redis Metric Group>” to get only the list of monitored metrics for your specific Redis database. From this list, you can then select the specific metric for which you want to configure an alert. As an illustration, in Figure 12, the chosen metric of interest in ‘Alert me when’ is ‘Custom: Redis Metrics: Used cpu user’ and the condition for triggering the alert is if the average value is more than <entered value from dropdown>.
- For at least: The duration for which the alert condition must be valid for the alert to be triggered
- Matching tags: By default, (match everything) is chosen. If needed, you can attach tags to a particular metric object and select those tags here, which would cause only alerts on that metric object to be triggered.
- Excluding tags: By default, (exclude nothing) is chosen. If needed, you can attach tags to a particular metric object and select those tags here, which would cause alerts on that metric object to be skipped.
- Annotate: When enabled, an annotation is automatically created when the alert is triggered. Annotations will be visible in the custom metrics dashboard where the data stream is displayed.
- Automatic Clear: When enabled, the alert issue is automatically cleared if the triggering condition is no longer true
- Notify on clear: When enabled, notifications are also sent when the alert issue is cleared. Please do note that notifications are always sent when the alert issue is triggered.
- Send Notifications To: Here you can configure the notification mechanisms by which the alert is communicated to you and others in your team.
Uptime Cloud Monitor supports notifying different sets of users with differing notification mechanisms for each alert type. Notification mechanisms include:
- SMS
- PagerDuty
- HipChat
- Campfire
- Slack
- OpsGenie
Webhooks are also exposed for clients to configure custom notification mechanisms.
More about setting up website probe alerts can be found here.
Uptime Cloud Monitor Free Trial! Sign up today!
Sign up for a 14 day FREE TRIAL of Uptime Cloud Monitor (no Credit Card required).
You can find more information about Uptime Cloud Monitor pricing options here.
We charge only $0.08 per month per metric!
Sign up today!